
If UK Data Centres Are Such Big Power Consumers How Big Is UK Power Supply?
Elcern Consulting took a look at the UK government's most recent publication of the annual UK electricity statistics. Our annual review watches for key trends and insights within the UK's electricity consumption and supply.
Key aspects from this update are:
- Electricity demand in 2024 was 319 TWh
- Demand was met from a mix of generation (around 90%) and imports (the balance)
- Over 90% of generation came from a mix of five main fuels: gas, wind, nuclear, biofuels and solar; the balance was from hydro, oil, coal and other smaller fuels
- Total renewables just topped 50% of all generation for the first time during 2024
- While renewables led generation, the majority of the ca 30% contribution from fossil fuels was largely gas-fired which continues to be a key foundation of national supply
- The UK’s final coal-fired generator (Ratcliff) was closed
- Nuclear continued its important contribution at around or just under 15% of 2024 supply.
- Imports were as usual led from France with its strong fleet of nuclear facilities
- Given that gas remains a foundational fuel for the UK’s electricity generation, much further investment will be needed for clean sources to reach at least 95% of Great Britain’s 2030 generation under the government’s Clean Power Action Plan
Exciting times!
Data centres are building quite a new demand for electricity
Diving into the Department for Energy Security and Net Zero (DESNZ) July 2025 electricity statistics, allows organisations to investigate some of the challenges with UK power supply. Whilst all UK consumers face those challenges, the near-avalanche of new AI-backed data centres are fast becoming key stakeholders.
Many of the many existing and forthcoming AI Growth Zones may be over 100MW in capacity, and in some cases over 300MW. Each one may feel equivalent to a significant power station in terms of just MW. And the concept of the AI growth Zone is to attract an ecosystems of companies using AI, all of whom could bring their own significant electricity demands. So its a very exciting time for UK electricity.
In aggregate the UK could well be looking at a substantial electricity demand increase, to be met by a supply side that features significant heritage assets and network configurations.
DESNZ publishes UK energy statistics each July. We think it’s well worth organisations examining each DESNZ dataset in order to validate or update strategies and plans and support decision-making.
Overall UK electricity demand remains broadly stable
DESNZ noted that for 2024, electricity demand was broadly stable, increasing 0.5% on last year and reached 319 TWh. Nevertheless, they highlighted that demand remained well below the pre-pandemic levels. For us, that may imply that any return to pre-pandemic demands could require substantial increases in supply. And that factor may precede the demands of new AI data centres.
Components of UK electricity consumption
We have been told by DESNZ that they report electricity demand from operating data centres under “Commercial Consumption”, and not as a line item in its own right. Commercial consumption was actually the 3rd largest in 2024, with electricity for housing markets dominating, followed by industrial consumption (see insert of UK Final Electricity Consumption, TWh).
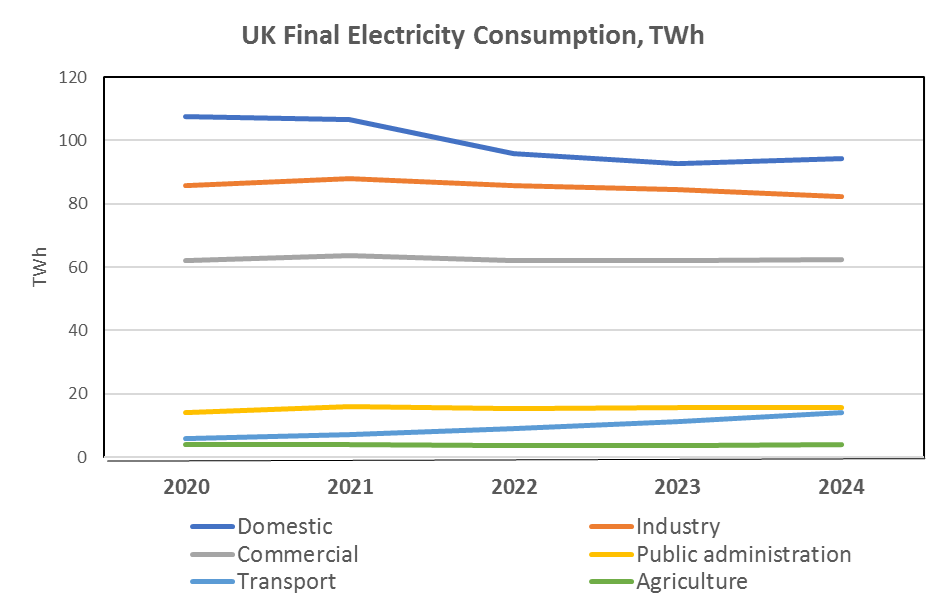
Data source for UK Final Electricity Consumption, TWh insert = Source 1
There's a lot more trend analysis than above from the data underlying the sectoral demands shown in the insert. However, in this note we leant solely towards potential challenges for data centre consumption. So we consider it may be intriguing to track commercial consumption over the next few years to see the impact of data centres. Indeed, we have advocated to DESNZ that it’s time for data centre electricity demand to have its own reporting line for transparency on what could become a major consumer.
Looking at supply and how it currently meets demand, DESNZ provide a wealth of important data.
Our first observation is that the trend in UK generation has been somewhat in decline. Since 2020, total generation has fallen 8% according to DENZ data (see insert ‘UK Electricity Generation 2020-2024’).
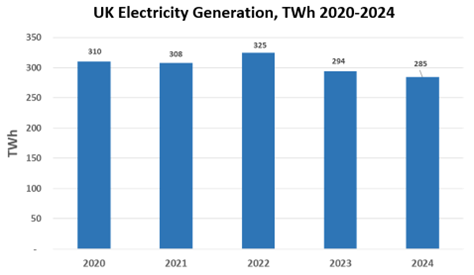
Data source for UK Electricity Generation, TWh 2020-2024 insert = Source 1
UK Generation Fleet
Our next observation comes from looking at the substantial fleet of generation facilities and its range of fuels.
The fleet of UK generation facilities is made up of those operated by Major Power Producers (MPPs) with the balance operated by non-MPPs (DESNZ’s ‘Other Generators’). The MPP fleet contributed around 80% of generation in 2024. Non-MPPs provided the 20% balance of 2024 generation.
MPPs alone operated nearly 1,400 facilities during 2024, demonstrating the scale of the fleet (see insert ‘UK Electricity Generation Fleet Count by Fuel’).
The number of installations operated by MPPs for each fuel as of the July publication date told its own story. Solar led the way with just over 660 facilities. Wind followed with nearly 490 installations. Taken together, solar and wind accounted for 1,150 of the near 1,400 total UK generation facilities operated by MPPs.
That aggregate 84% contribution left five other sources (in order of count: gas, biomass, oil and nuclear) to provide the remaining 16% of capacity for MPPs.
MPPs are of course only part of the fleet and are indicative of the minimum count, with counts for “Other Generators” that made up the other part not available.
The large fleet size for solar is particularly stark when compared to the 5 nuclear stations, and spoke to widely differing scales. Considering just the MPPs, many solar farms reported by DESNZ in 2024 were less than 70 MW capacity each, whereas the average nuclear facility capacity was 1,177 MW. Since solar provided 5% of actual 2024 generation whilst nuclear provided 14% it becomes clear how much effort distributed solar takes to reach scale. That said, we noted that the substantial Cleve Hill solar farm’s rated capacity of 373 MW begins to change that picture.
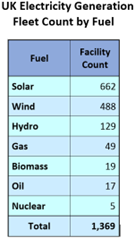
Data source for UK Electricity Generation Fleet Count by Fuel insert = Source 1
Fuel Types in UK Generation
Looking in more detail at different fuel sources, it took six fuel types plus a smaller assortment of ‘other’ fuels to achieve the 285 TWh of UK generation in 2024 (see insert ‘Electricity Generation by Fuel, TWh’).
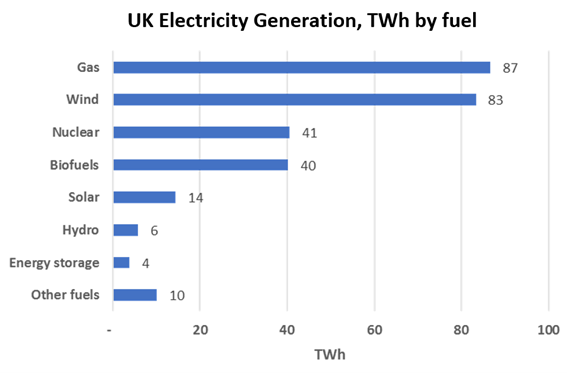
Data source for UK TWh by Fuel insert = Source 1
Our takeaways on fuel types were as follows:
- In absolute terms, gas and wind dominated the fuels used for power generation in 2024. Each provided over 80 TWh, with gas leading the way by a good margin. This is quite a stark reminder of the importance of gas in UK generation.
- Biofuels and nuclear each provided around 40 TWh, meaning it took both sources to nearly match what either gas or wind provided.
- Then finally at the bottom of the stack, it took solar, hydro and all other fuels in aggregate to contribute less than either biofuels or nuclear provided.
Thought of in percentage terms, gas and wind were each around 30% for a total of 59% of 2024 generation. The biofuels and nuclear were each around 14%, taking the total for gas, wind, biofuels and nuclear up to shy of 90%. Solar only contributed 5%. The final balance to 100% was then from a whole variety of fuels like coal, oil, wave etc.
So, whilst hugely satisfying to see renewables contribute so highly, it is also intriguing how much work remains to replace fossil fuels. That’s even when recognising an “unabated gas supply” will remain available to be used only when essential under the government’s clean power action plan. Nevertheless, coal was finally phased out of the generation mix during 2024. So challenges to further renewables include the extent of gas generation, and the huge coming growth in demand.
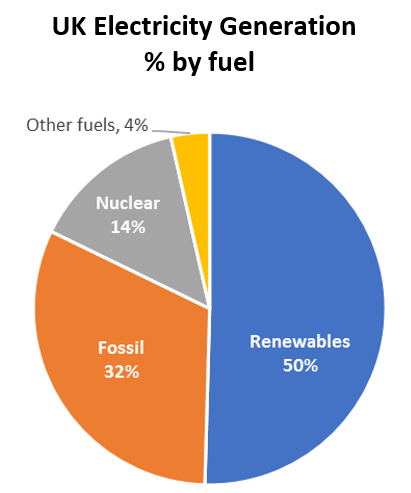
A further insight comes from checking progress towards clean fuel sources (see insert ‘UK Electricity Generation, % By Fuel’). Nudging just over 50% of total generation in 2024, renewables scored a new record contribution. Fossil fuels accounted for just over 30%. Nuclear made the other major contribution with just under 15%.
UK Generation Supported by Imports
Our final observation with the 2025 DESNZ energy statistics lies in the UK’s current reliance on electricity imports. Overall, the UK’s international interconnectors provided a further 33 TWh net supply (See insert ‘UK Electricity Import/Exports, TWh’).
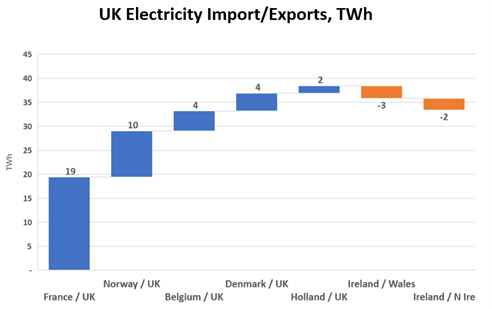
Data source for UK Electricity Import/Exports, TWh insert = Source 1
The net international supply was made up of electricity imports from France, Norway, Belgium, Denmark and Holland, and exports to Ireland. The French electricity interconnector is of course well known and by far dominated the UK’s 2024 electricity imports. Norway was about half the French supply. At the bottom of the import stack, Belgium, Denmark and Holland taken together matched Norway.
Getting to Grips With the Data
Vastly more analysis is available per fuel type which we have not brought forwards here but may be equally valuable. So we encourage organisations to get to grips with the DESNZ data following its publication each July. Do especially read the official DESNZ annual summary as well as the individual data tables. Armed with an understanding of the latest trends and challenges, organisations may find themselves ever better equipped to validate or update strategies, plans and better inform key decisions.
We can help …. At Elcern, we dedicate a significant amount of time to analysing UK electricity trends and challenges, particularly for data centre power sourcing strategies. We review and examine a multitude of national and regional energy data to forge a deep understanding of how organisations can align to and benefit from government strategies. Our outline annual energy analysis above hopefully indicates our aim to encourage organisations to analyse government data and relate it to purchasing strategies and decision-making.
Do let us know if we may support you within this evolving and exciting area
Explanatory Notes to Inserts
Notes to insert “UK Electricity Generation by Fuel”, TWh:
- “Gas” includes natural and sour gas
- “Wind” includes offshore and onshore
- “Biofuels” aka Thermal Renewables includes biomass, MSW, energy From waste etc
- “Hydro” includes natural not pumped flow
- “Other” fuels include coal, oil, wave
Acronyms
DESNZ = Department for Energy Security and Net Zero
Source Documentation
Source 1 = Chapter 5 Electricity, Digest of UK Energy Statistics, Department for Energy Security and Net Zero. July 31, 2025
DISCLAIMER: The above research note was prepared solely for an initial, draft, high-level perspective, based upon published DESNZ electricity data. It should not be taken as accurate or complete. It is purely a basis for discussion, relating only to its preparation date. Recipients should consult the original source material, and conduct their own research to reach any conclusions, decisions, or actions.